One of the questions we often get asked by accountants is “why is there such a big difference between the industry average and benchmark profit margins for accounting practices?”
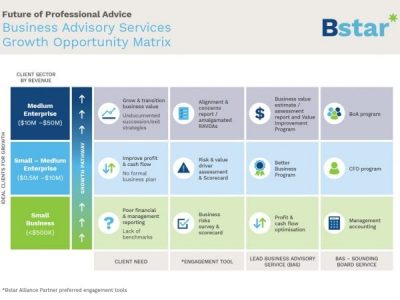
To achieve benchmark performance (top 20%), there are three key benchmarks categories you can focus on:
- Revenue & services – mix, margins and growth rates;
- Partner and key staff – utilisation, productivity and performance;
- Material fixed operating costs.
Benchmarking is only as good as the quality of data entered and being able to compare your practice performance to ‘like’ practices.
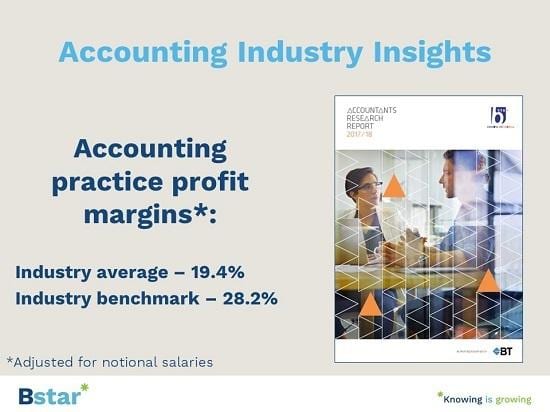
When we benchmark accounting practices, we adjust the financial accounts profitability. For example, our guidelines for notional salaries (Partner/Directors), in associated practice fee ranges are listed below:
- $0 – $1M: $150,000;
- $1M – $5M: $250,000;
- > $5M: $350,000.
If you are planning to use benchmarking information for your practice or your client’s businesses, I encourage you to source accurate industry benchmarks as we have some real concerns in relation to tax office and GLS system benchmarks. Click to learn more.